Review KmPlot Application
Our series of articles by Google Code In students continues with this review of graphing applications KmPlot by Andrey Cygankov.
Studying maths, I often work with functions and graphs. Graph plotter KmPlot is a great help with this. A list of its features shows it can do enough to solve even the most difficult tasks.
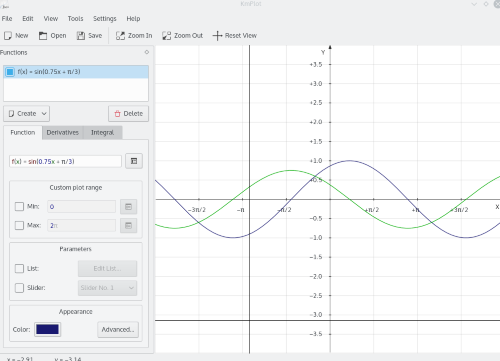
Drawing a function and its derivative.
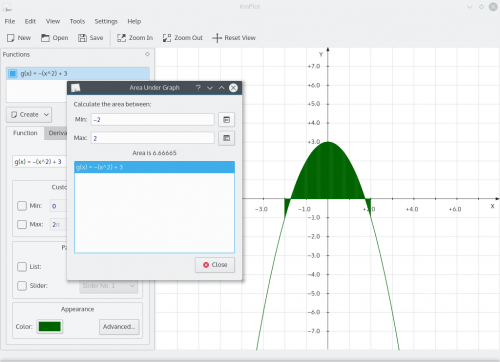
Finding the area under a graph.
KmPlot can:
- Draw various graph types: functions, parametric, polar
- Display on a flexibly configurable grid
- Draw 1st and 2nd derivative and the integral of a plot function
- Export in different formats: BMP, JPG, SVG and XML for futher editing
- Use custom constants and parameters
- Finding the minimum and maximum point in the function and the y-value of them.
KmPlot has important advantages, importantly it's open source with the opportunity to participate in development. If you have ideas for development - join the community and improve it! It has an easy and intuitive UI so you can start work with it quickly and easily.
The disadvantage of KmPlot is that it has no support on mobile platforms. This type of application is often necessary when there is no access to computer.
Of course, there are applications with greater functionality (Gnuplot, Gri, Grace and others) but all of them require a much greater level of training to work with them and their interface is not as friendly as in KmPlot.
KmPlot helps me in these problems for my homework. With KmPlot I can be sure my answers are correct. It helps with research of functions. KmPlot allows to edit functions as you like, which allows me to understand their properties.
As a student I have KmPlot in the category of "must have" application, and I think it will remain so for a long time. I recommend it to my friends.