Feed aggregator
Gently Global Theme [Global Themes (Plasma 5)]
Gently Plasma Theme [Plasma Themes]
Noir-Gently-White-Blue-Dark-Icons [Full Icon Themes]
Gently [Plasma Window Decorations]
Gently-Blur [Plasma Window Decorations]
Win11 icon theme [Full Icon Themes]
Windows11-Afterglow Global Theme [Global Themes (Plasma 5)]
Windows11-Afterglow Plasma Theme [Plasma Themes]
Digital art wallpaper [Wallpapers KDE Plasma]
Blue sky night wallpaper [Wallpapers KDE Plasma]
Fantasy sky wallpaper [Wallpapers KDE Plasma]
Moon night sky wallpaper [Wallpapers KDE Plasma]
Lightning sky wallpaper [Wallpapers KDE Plasma]
Beautiful nature wallpaper [Wallpapers KDE Plasma]
Digital sky art wallpaper [Wallpapers KDE Plasma]
Fantasy sky wallpaper [Wallpapers KDE Plasma]
Beautiful sky landscape [Wallpapers KDE Plasma]
Abstract watercolor landscape [Wallpapers KDE Plasma]
LabPlot 2.11 released
Say hello to LabPlot 2.11!
This brand new release comes with many new features, improvements and performance enhancements in several areas, as well as support for more data formats and visualisation types.
The main new features are outlined below. For a more detailed overview of the changes in this release, please refer to the ChangeLog file.
The source code of LabPlot, the Flatpak and Snap packages for Linux, as well as the installer for Windows and the image for MacOS are available from our download page.
This release includes more visualisations, usability improvements and a new worksheet preview panel:
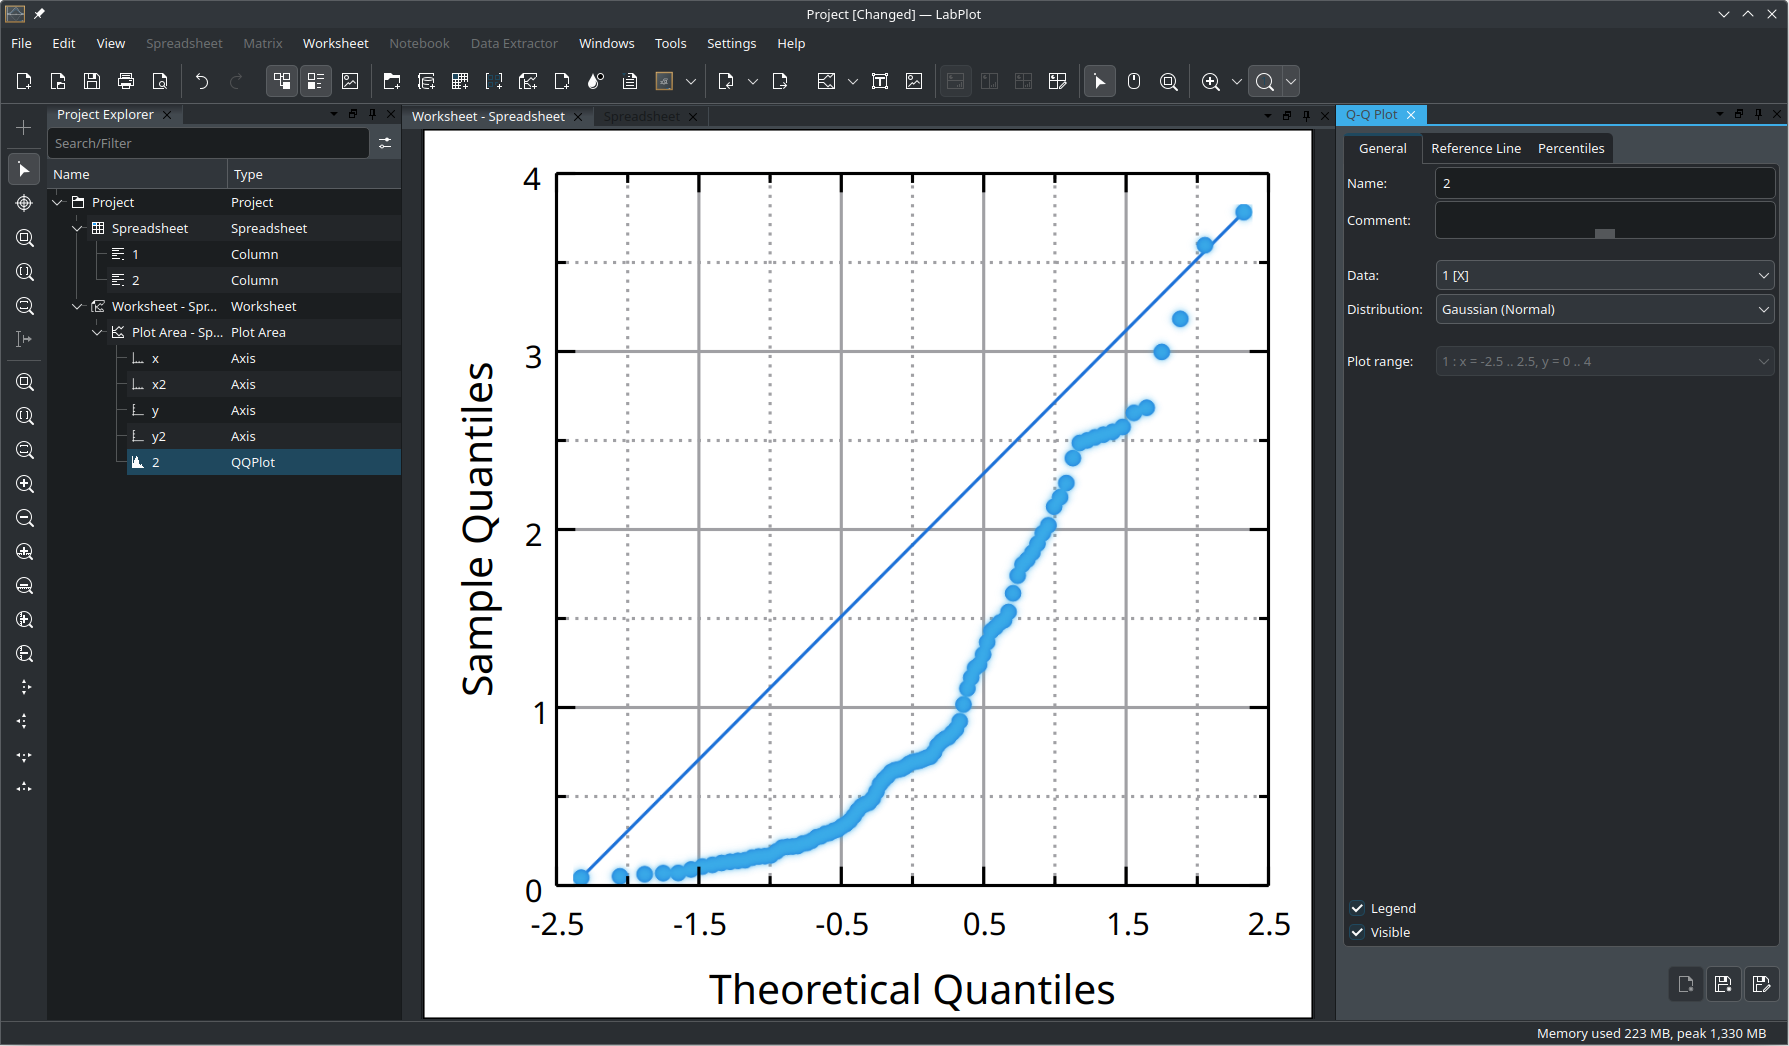
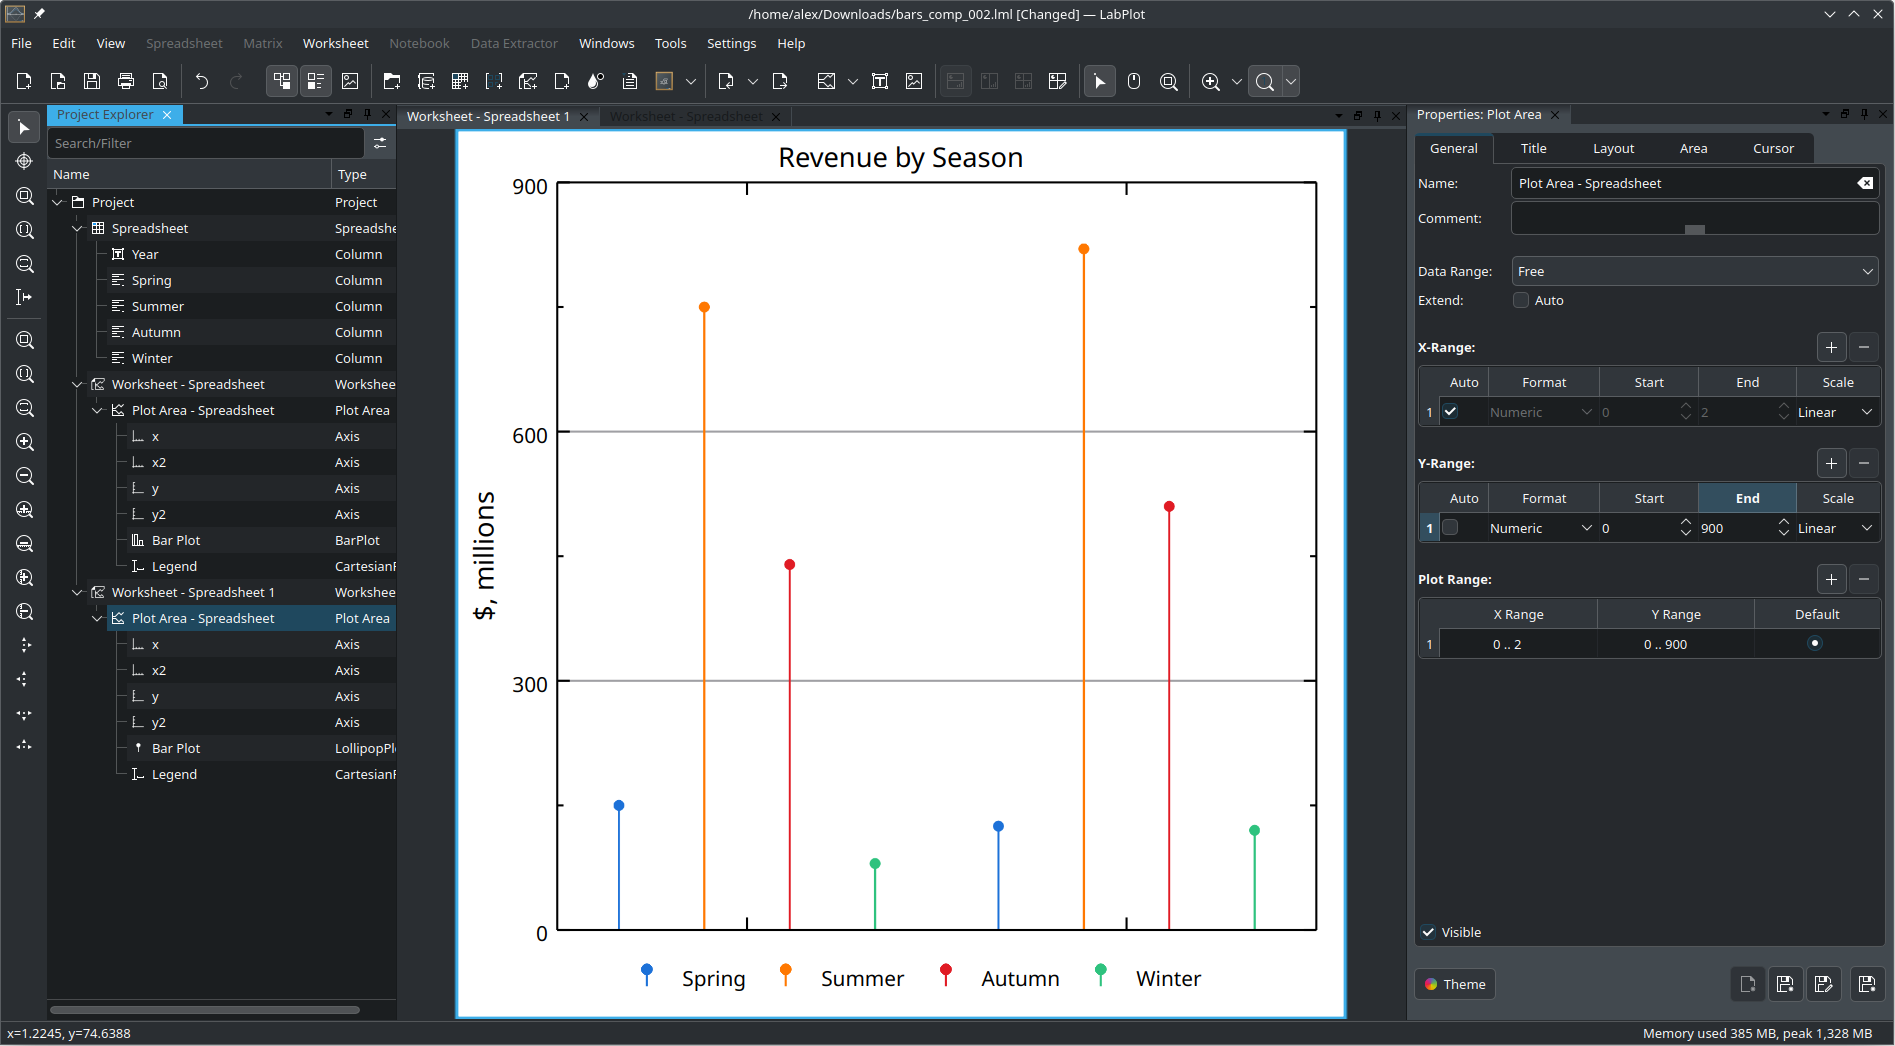
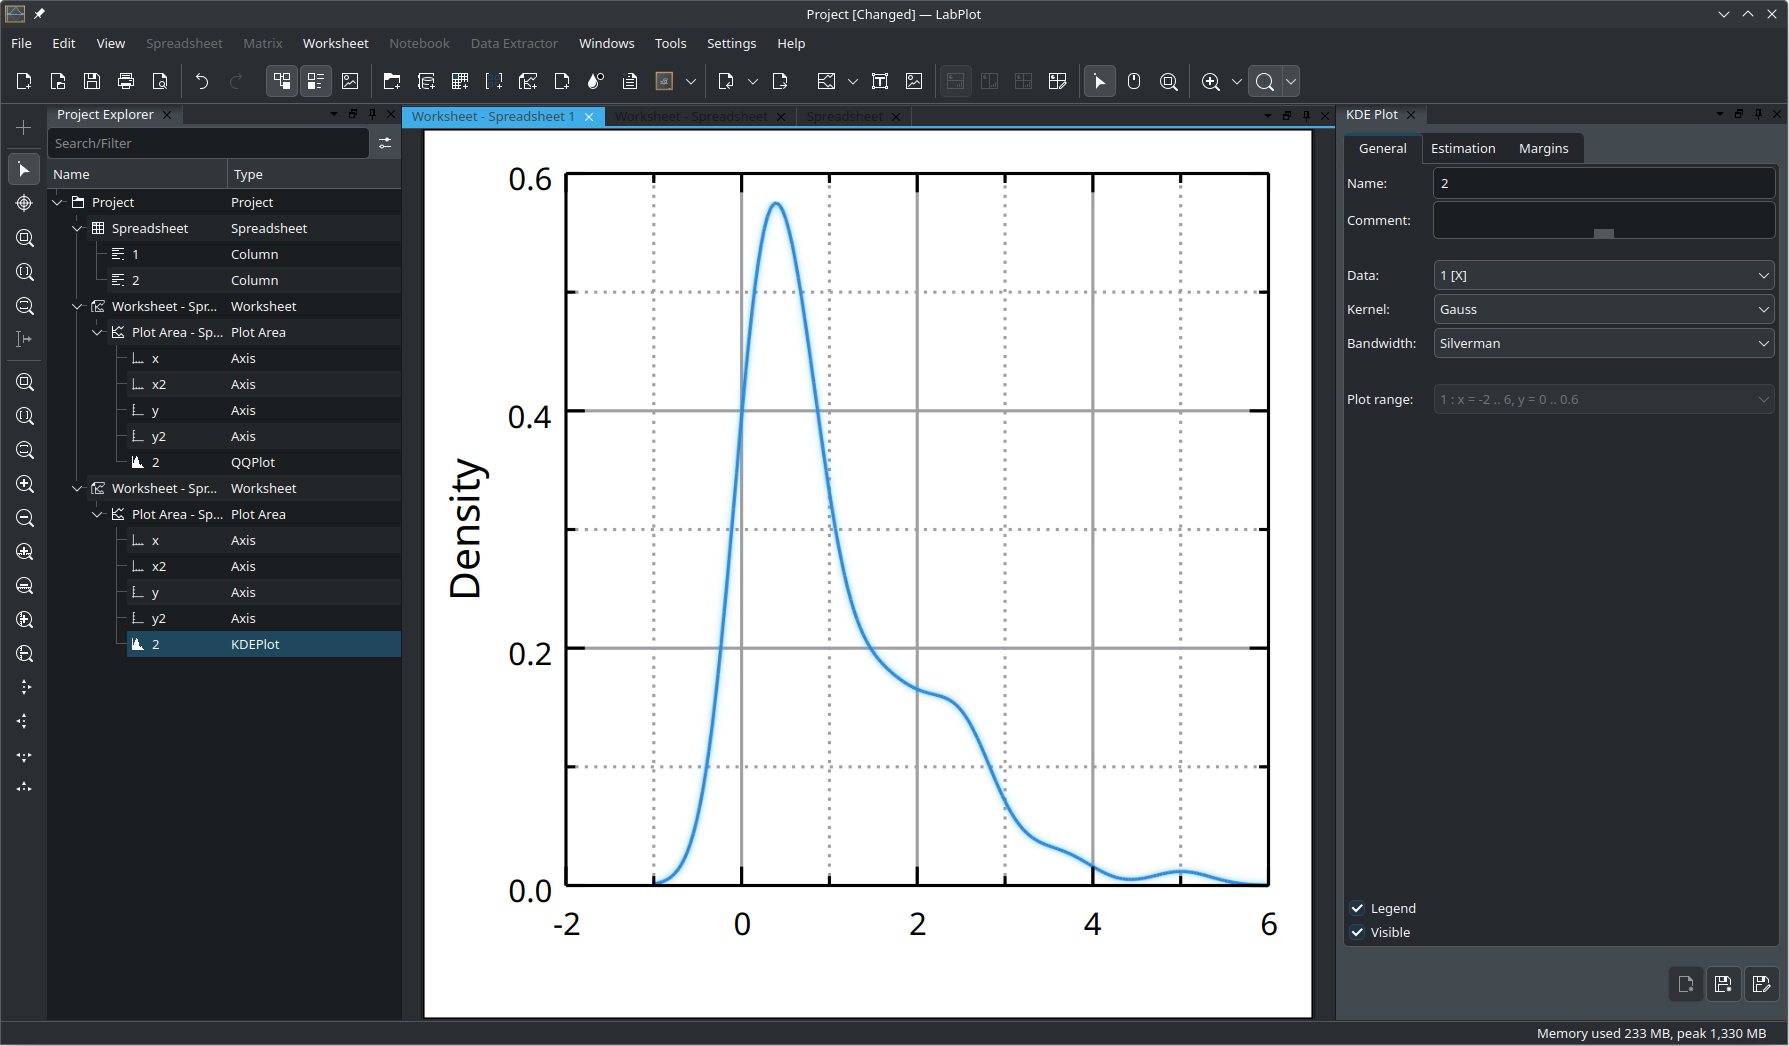
- You can now use Lollipop, Q-Q and KDE plots
- We have implemented error bars for bar plots
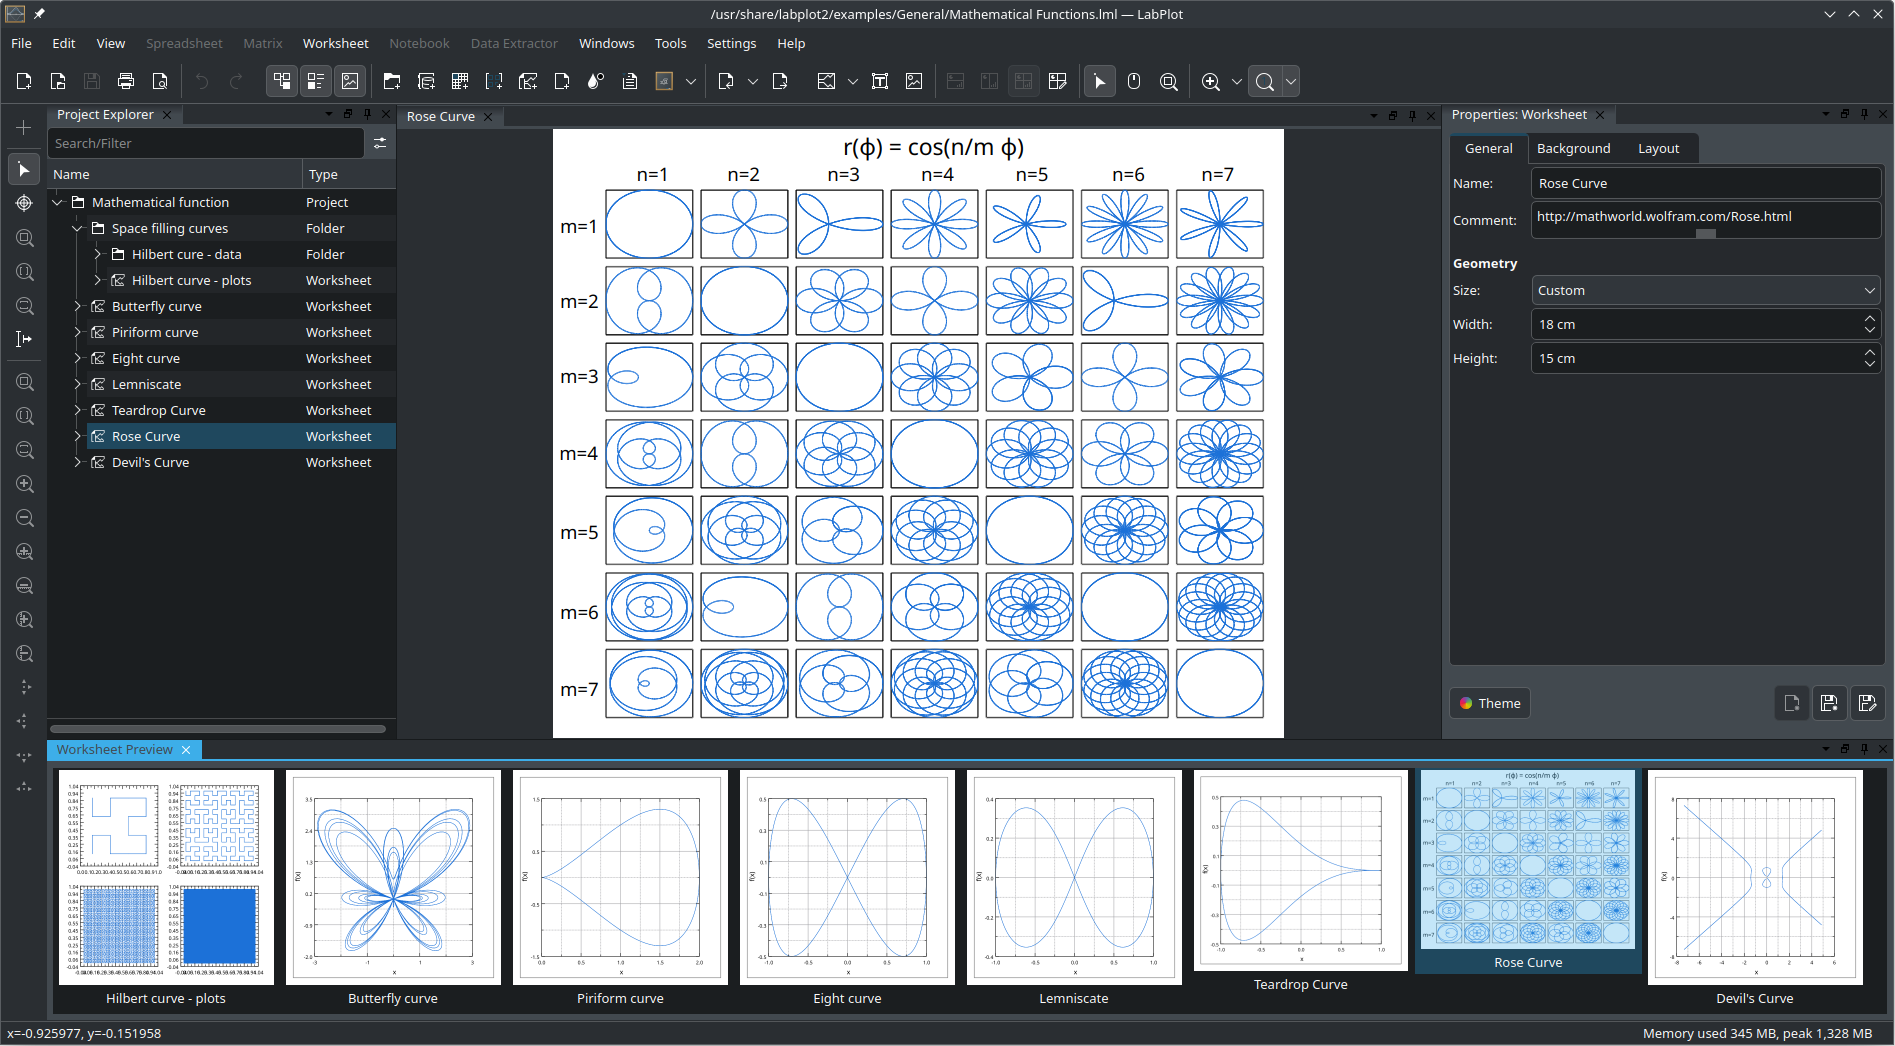
- There is a new preview panel for all available worksheets in the project
- You can use the navigation panel in the presenter widget to select, zoom and navigate in the presenter mode
- You can lock worksheet elements to prevent accidental changes
- LabPlot 2.11 allows you to show or hide the entry in the legend for all supported plot types and not just xy-curve
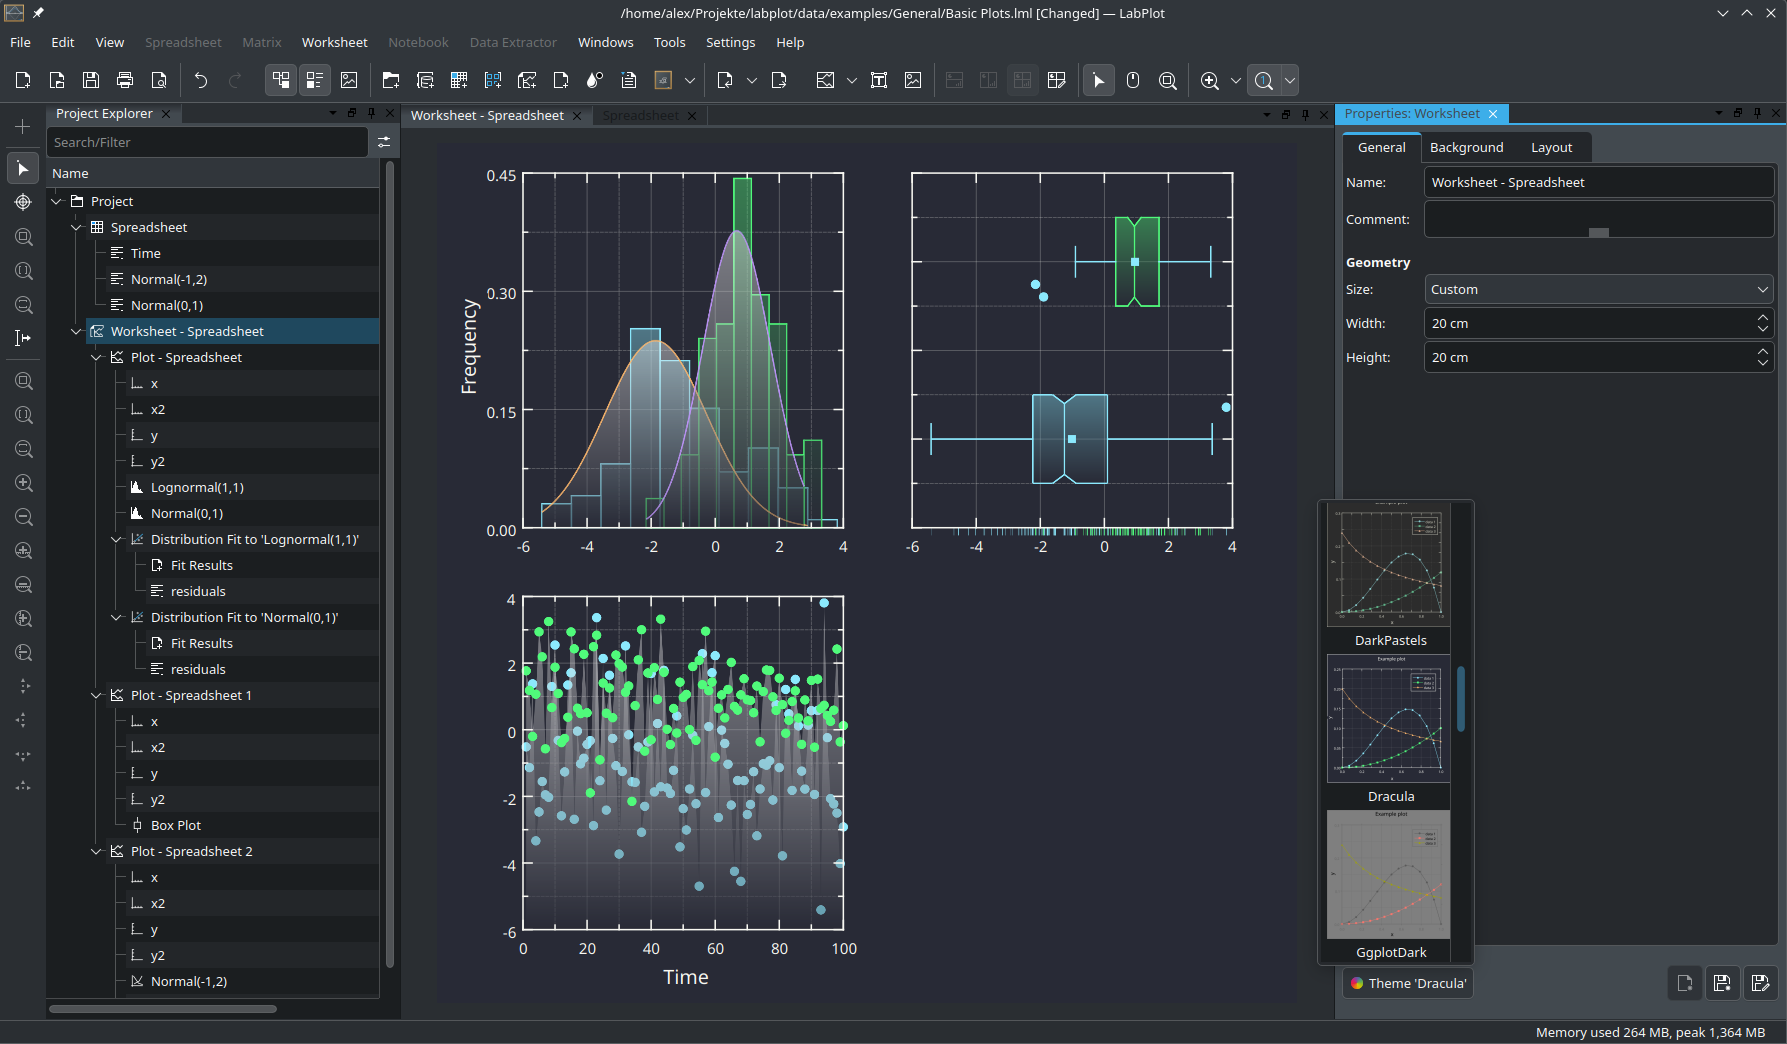
- You can give your worksheets a fresh new look with the Dracula theme
Spreadsheets gain more functions and operations to modify, generate and understand the data:
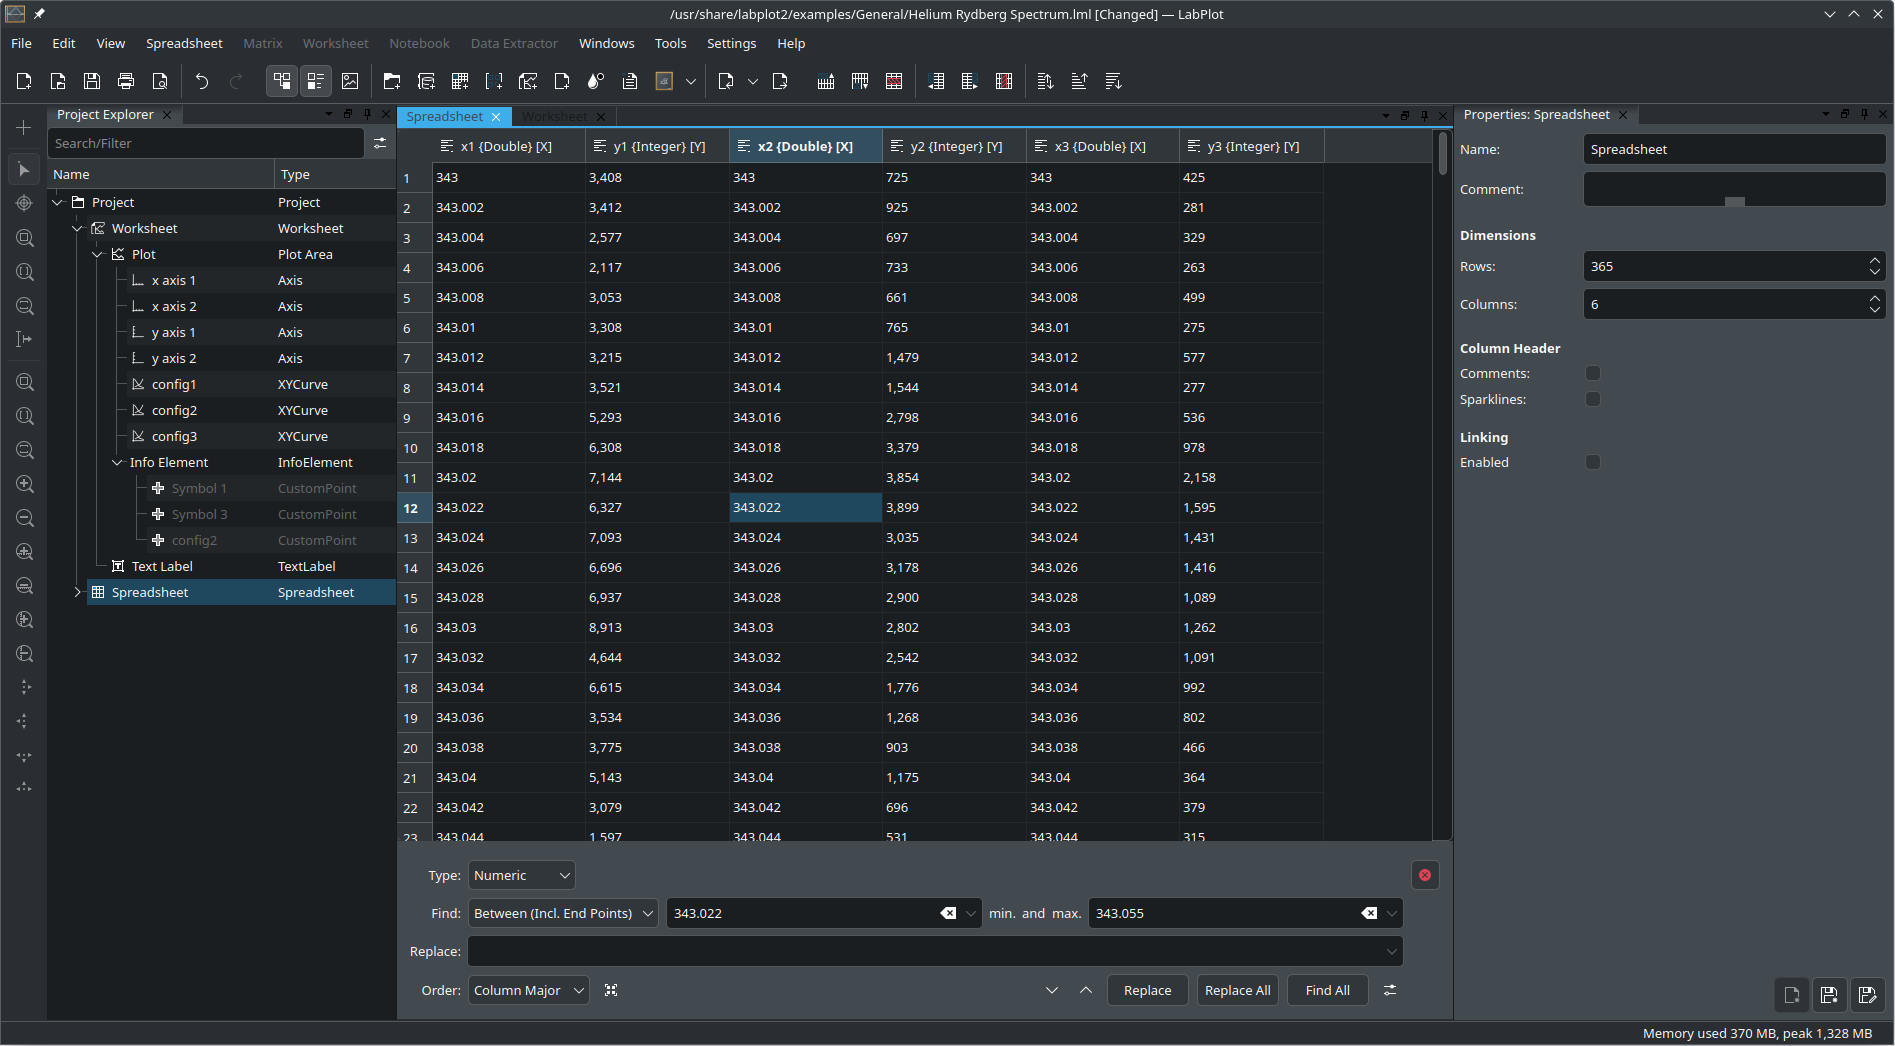
- We have extended the search and replace features
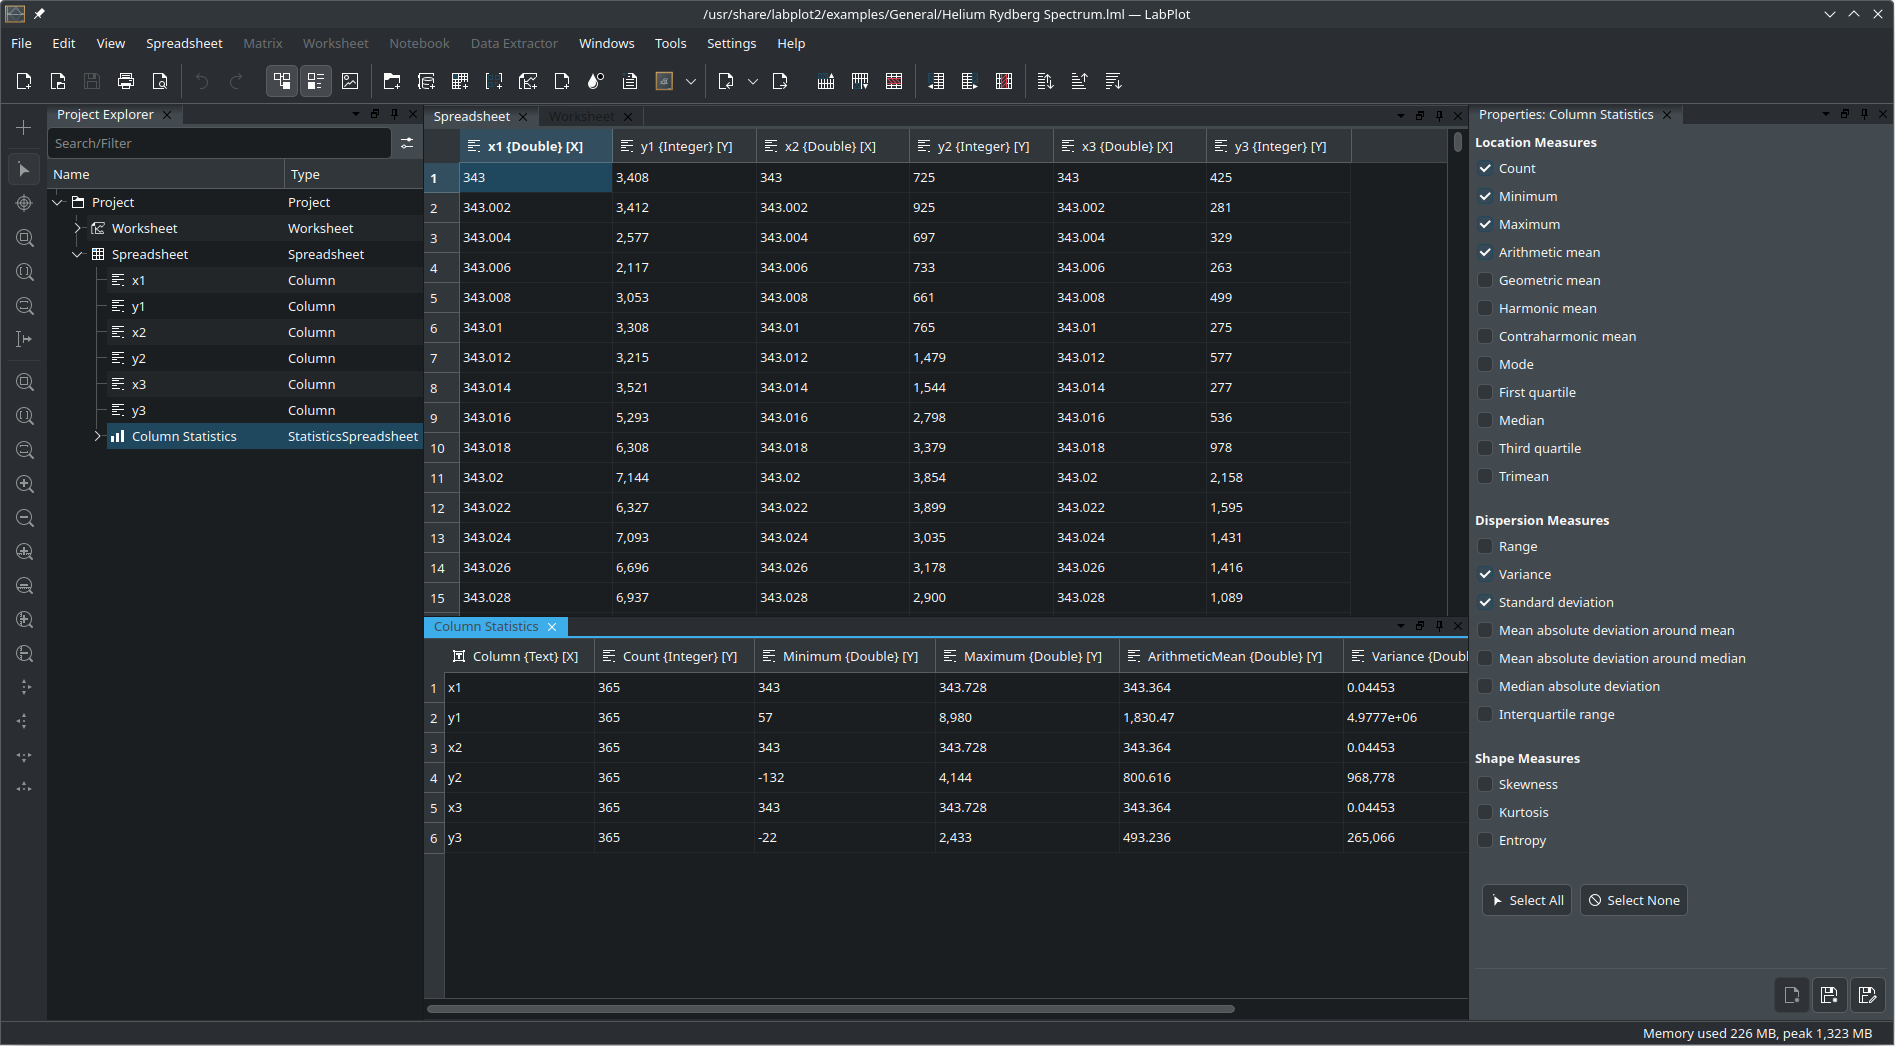
- You can check statistical properties of the parent in a new child spreadsheet
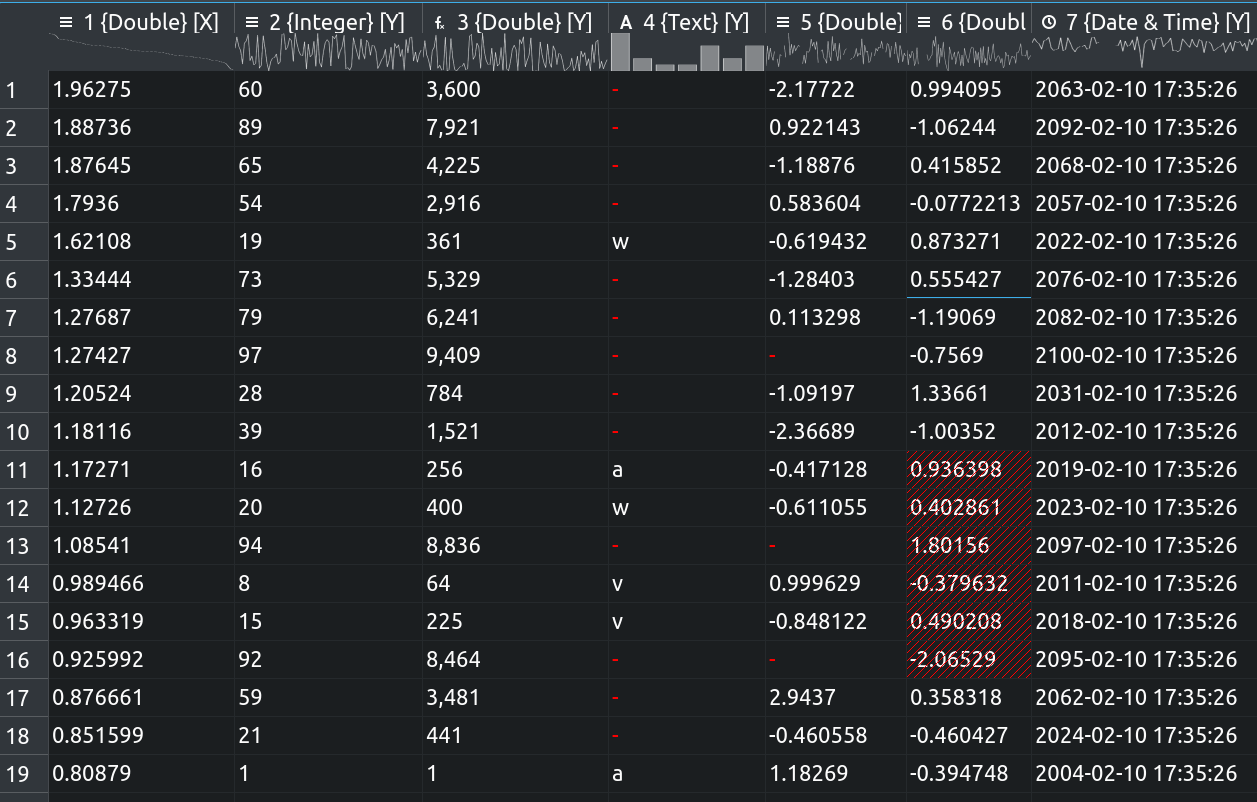
- We have added sparklines in the header of a spreadsheet
- LabPlot 2.11 comes with spreadsheet linking to synchronize the number of rows across multiple spreadsheets
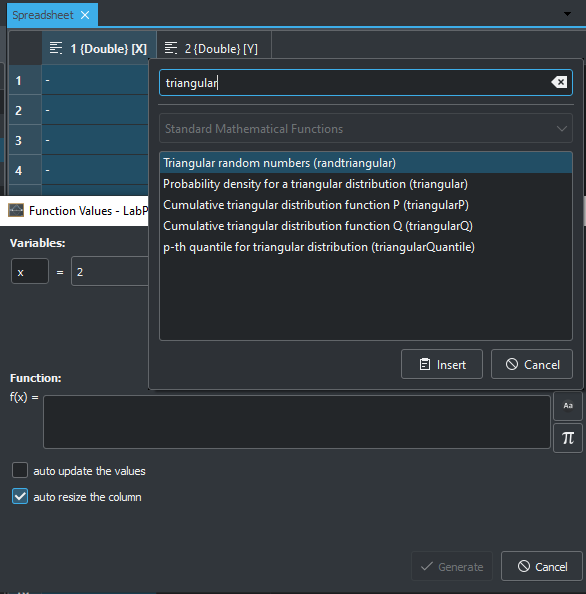
- We have implemented triangular distributions for PDF, CDF, and pseudorandom number generation
- Equidistant value generation has been extended
Analysis tools added to LabPlot 2.11 include:
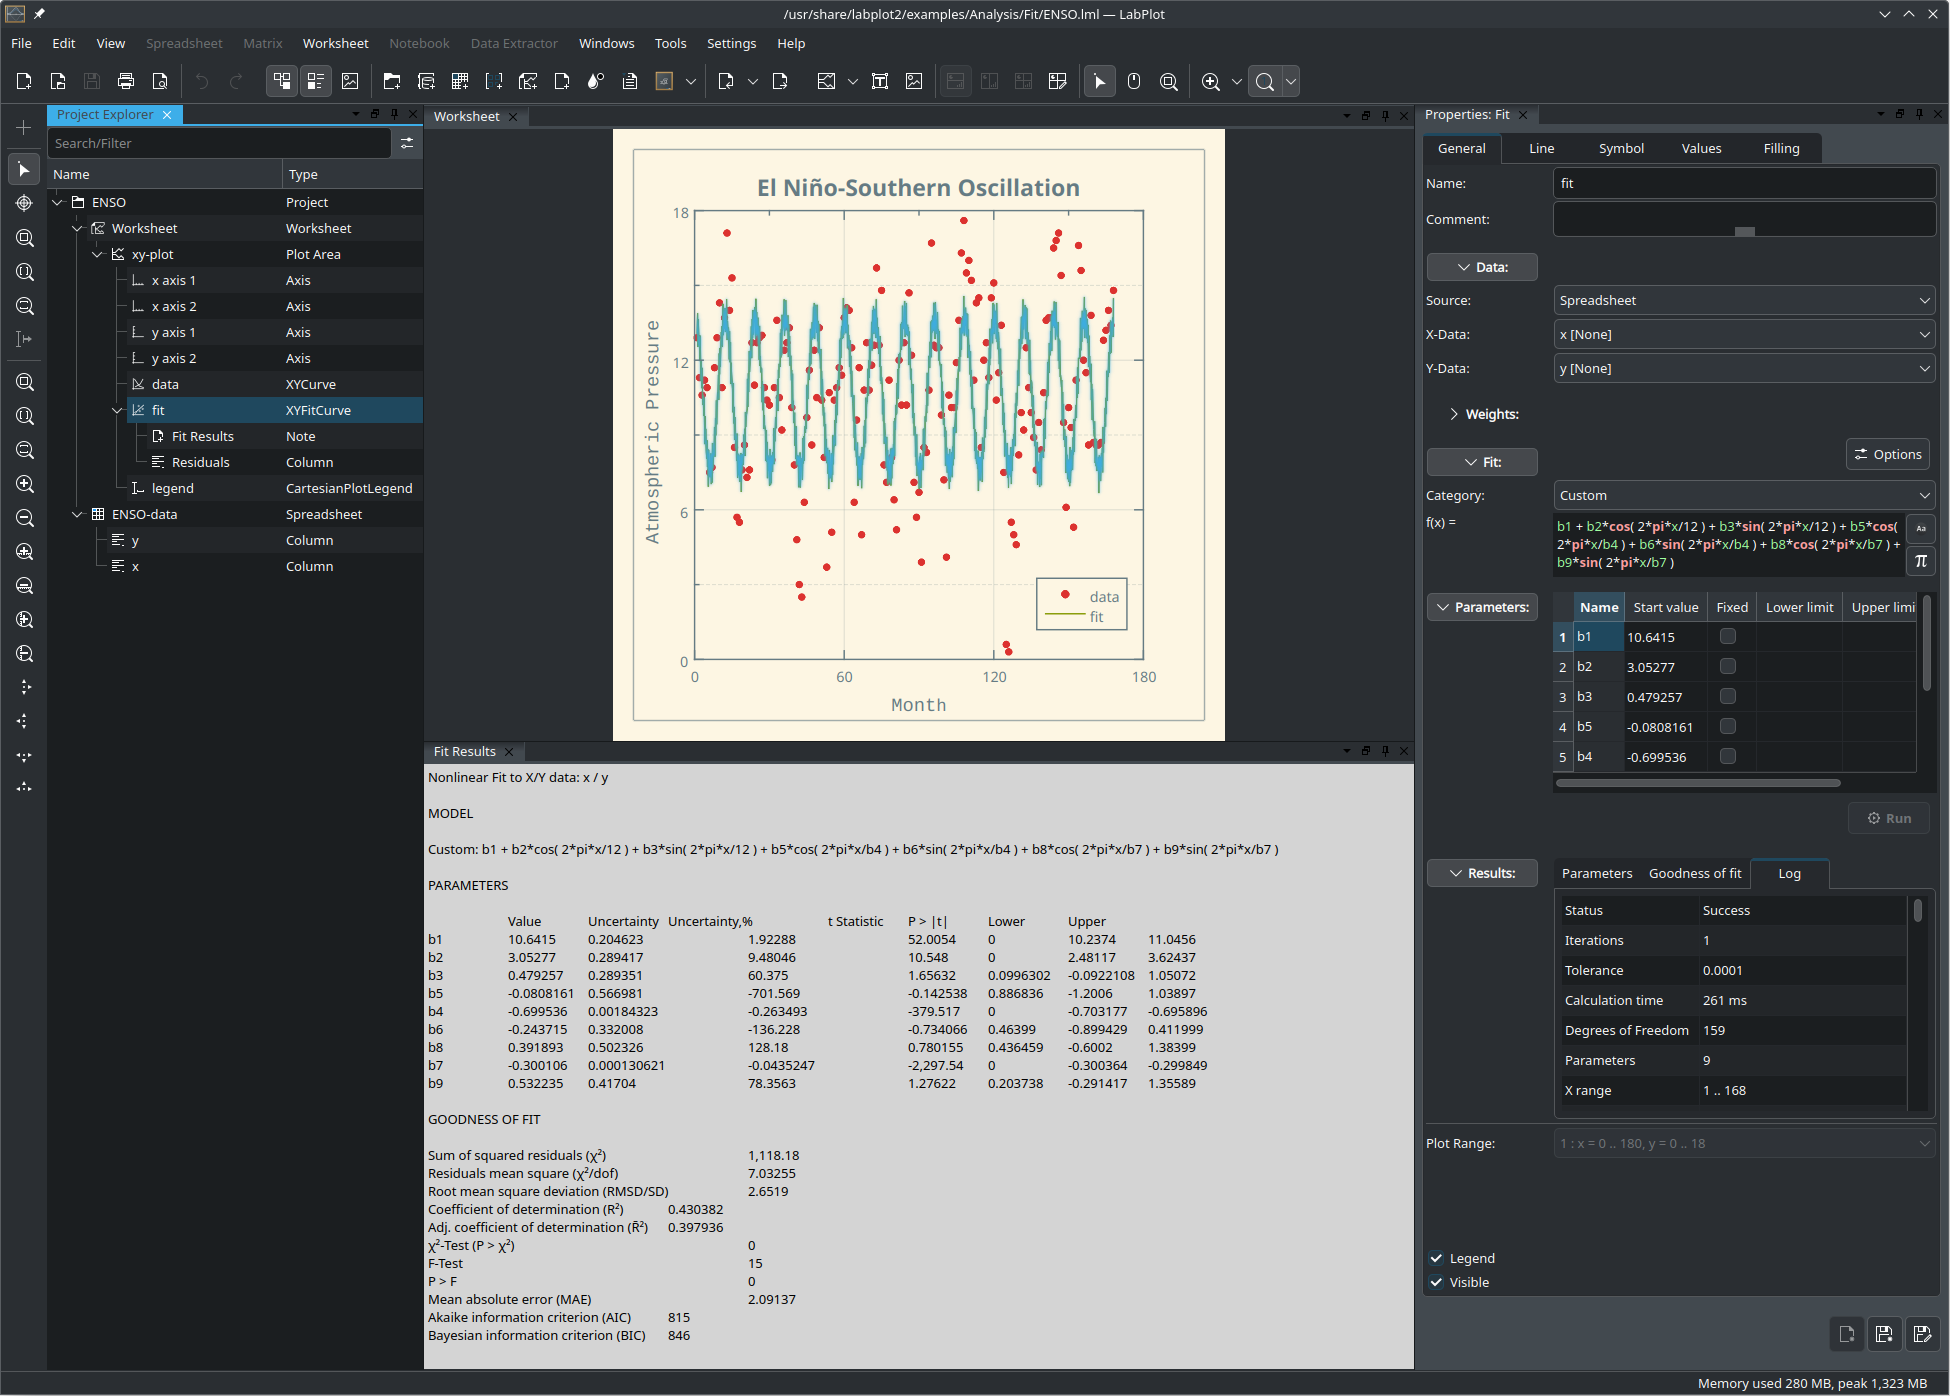
- Note showing the fit results
- Faster computation of the baseline removal (we switched to Eigen3 internally)
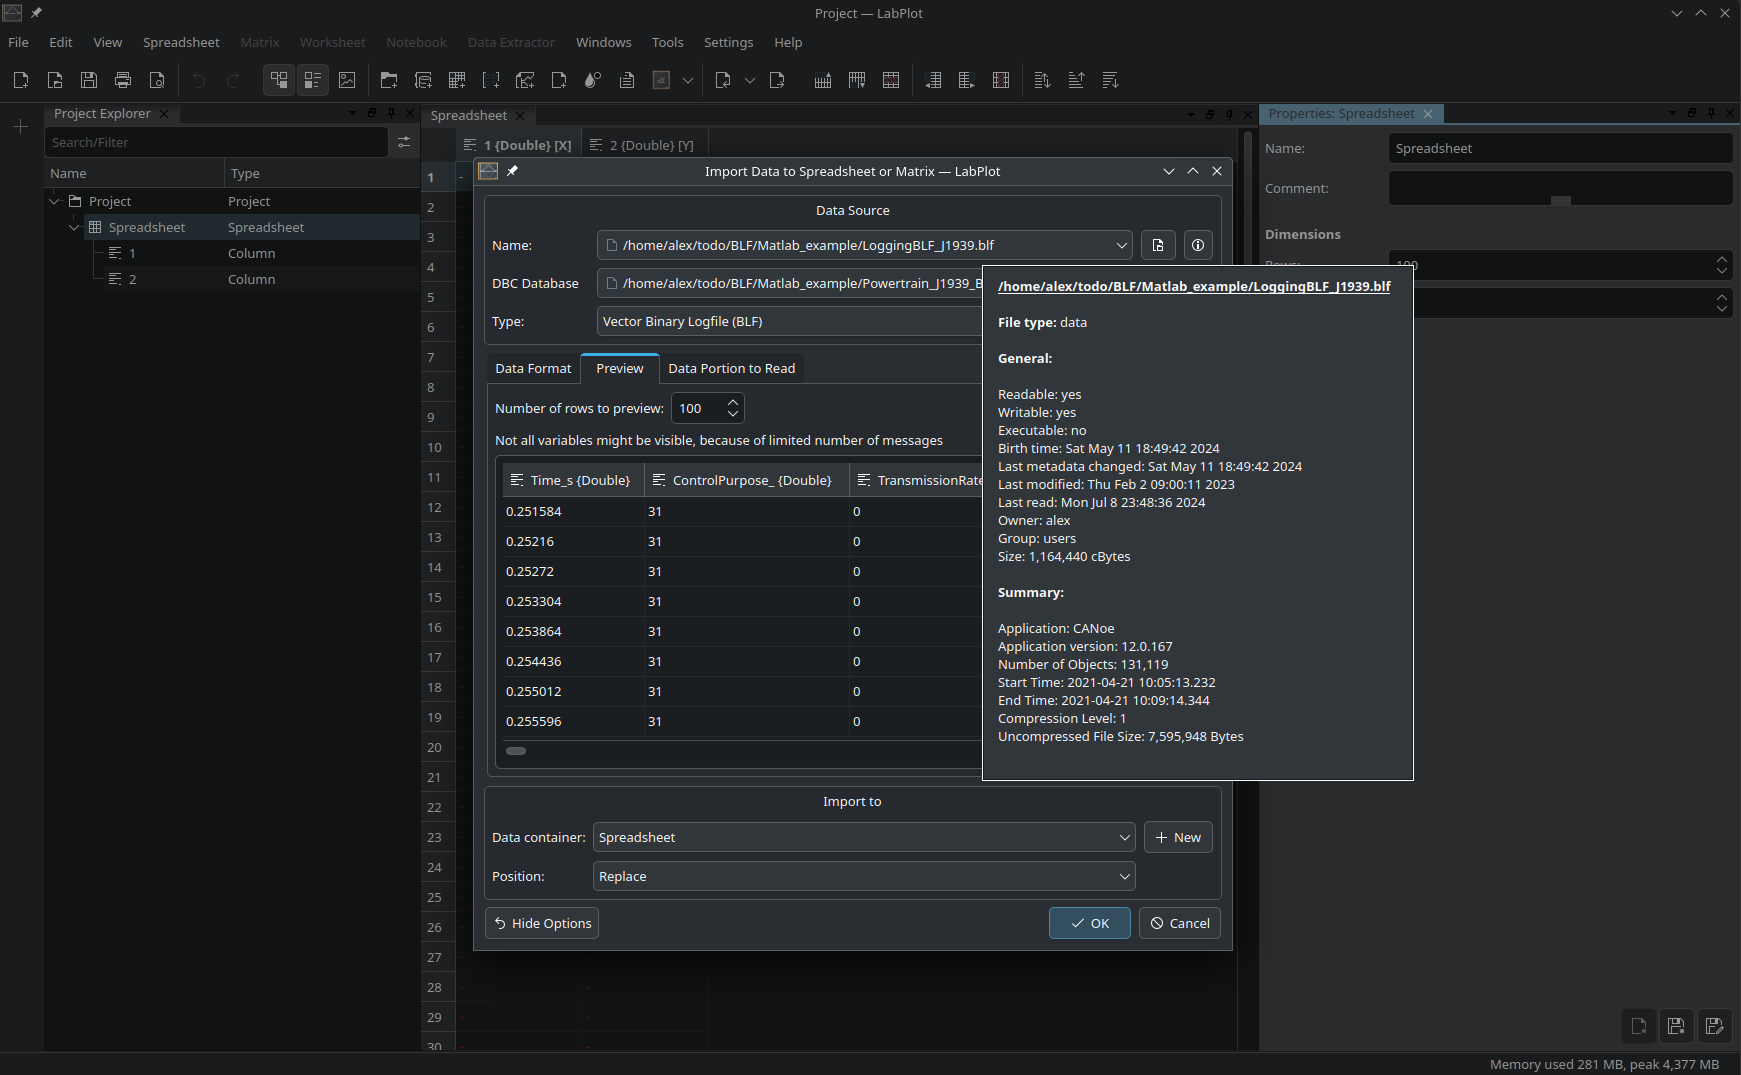
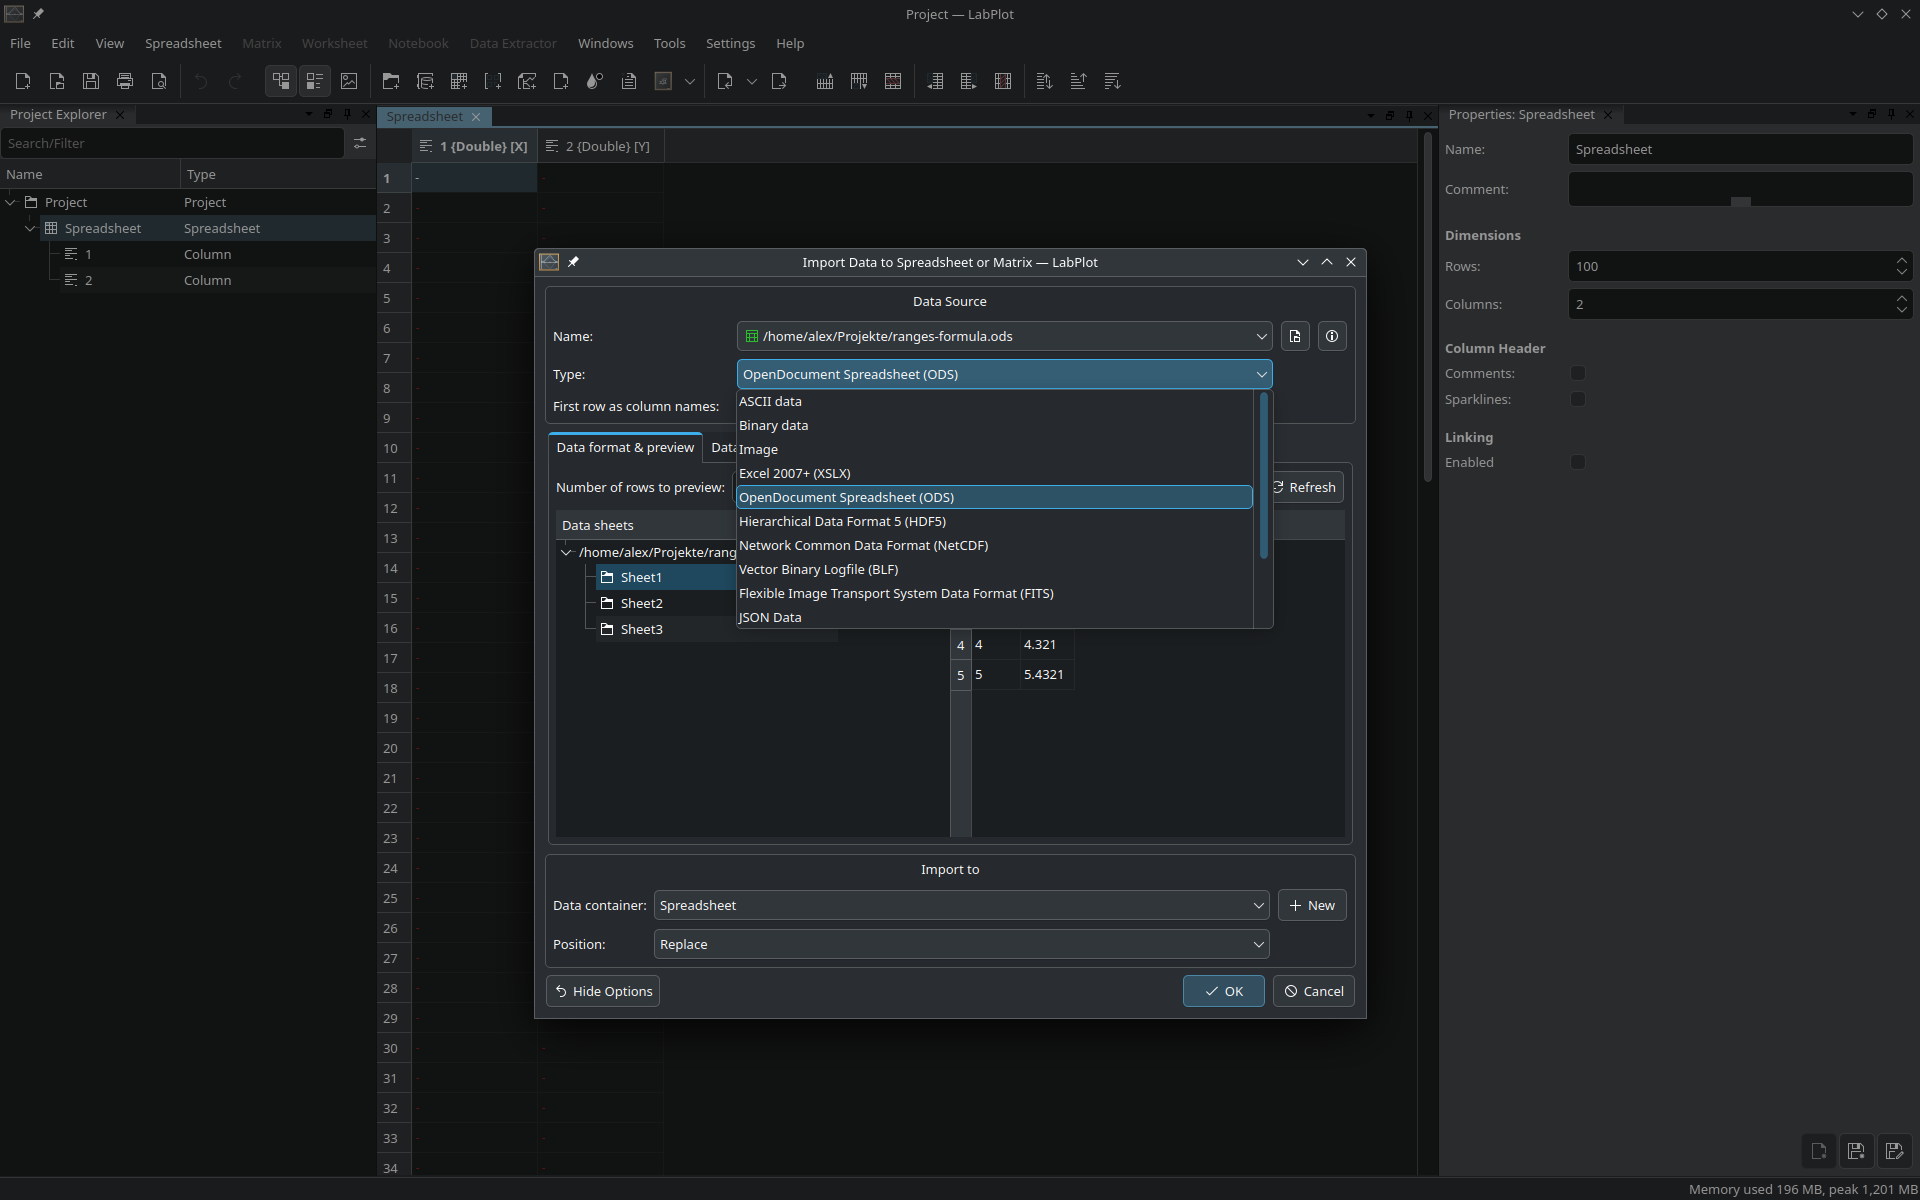
LabPlot 2.11 adds support for new file formats and multiple optimizations to improve the handling of edge-case scenarios:
- You can now import Open Document Spreadsheet (ODS) files.
- Templates for ASCII and Binary import filters allow you to save and load current filter settings
- There is a new feature that allows you to to specify the data range to be read (start/end values for columns and records) when importing from SQL databases
- LabpPlot can now gracefully handle out-of-memory situations when importing large amounts of data
- LabPlot 2.11 displays better error messages during the import
- We provide additional information about BLF files (application name with which the file was created with, etc.)
- We have made several fixes and improvements to the import of Origin’s OPJ files
The 2.11 release adds a number of usability enhancements to the Notebook interface:
- You can now export the notebook to PDF
- We provide statistics and a “plot data” action from the context menu in the project explorer for variables created in the Notebook
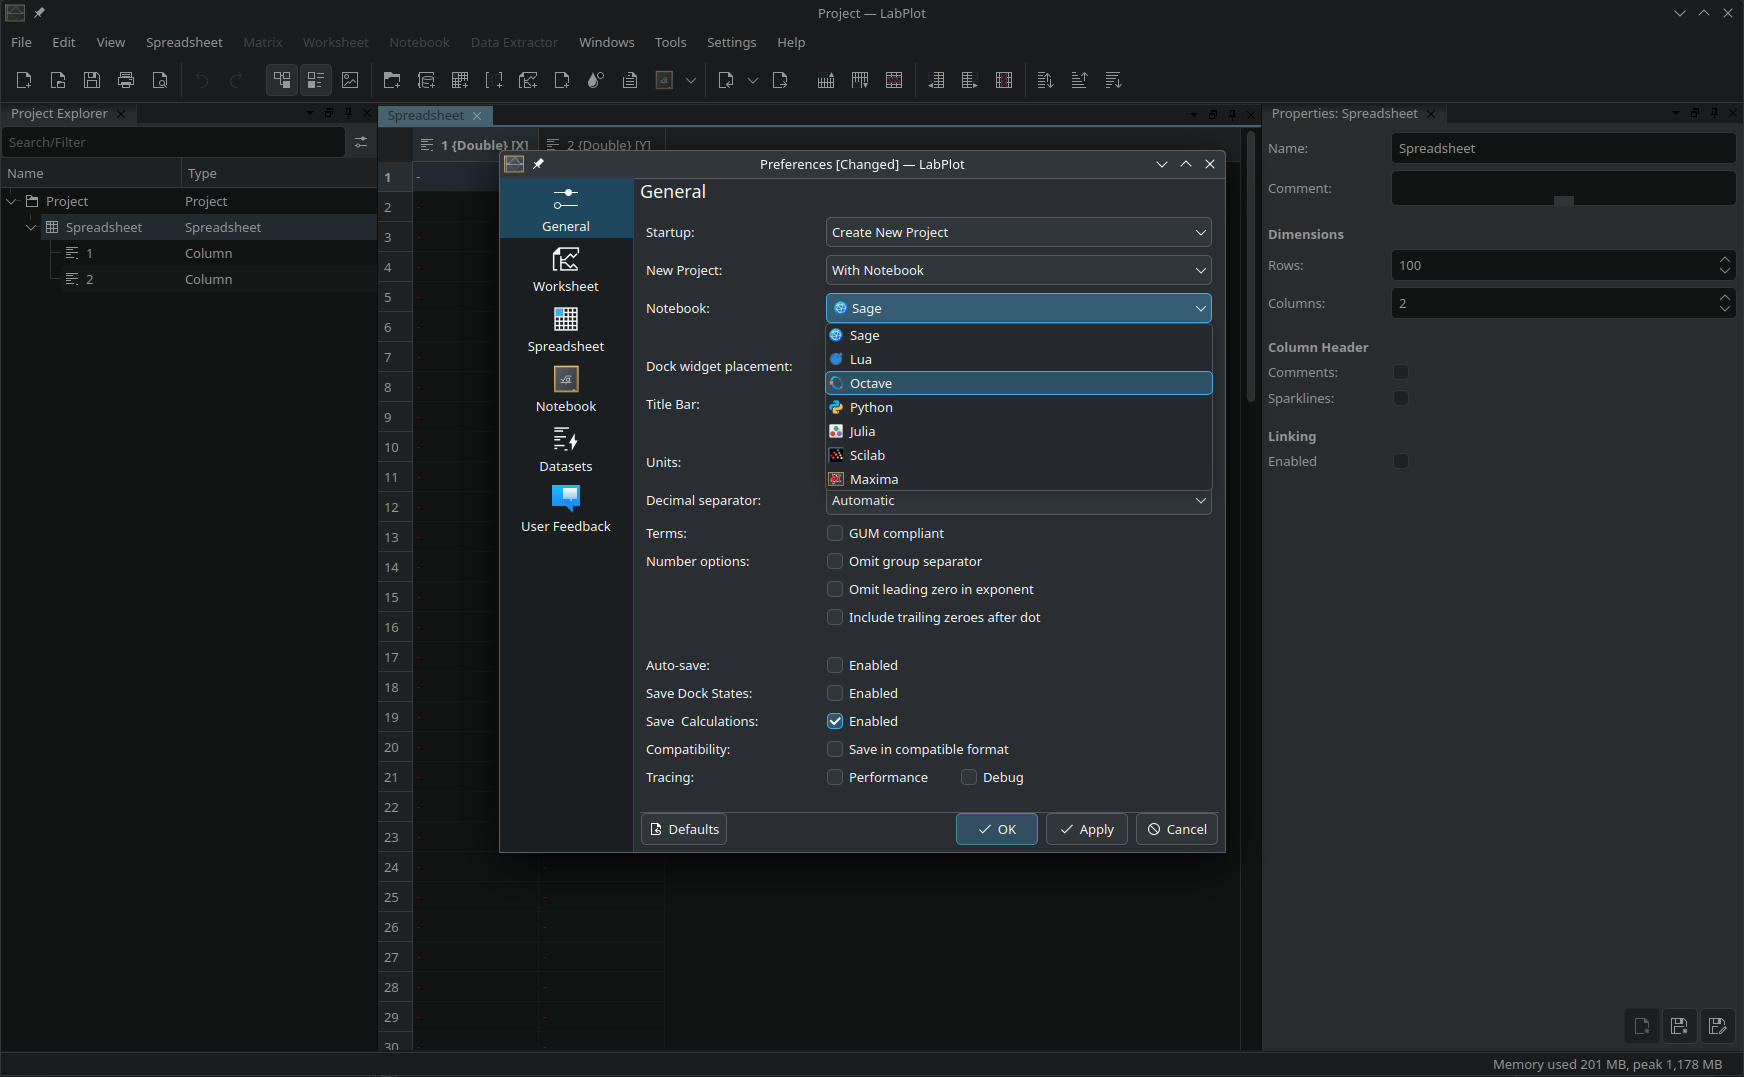
- There is a new option in the application settings to run a selected CAS engine on startup